Laser Raman Imaging System
Make and Model
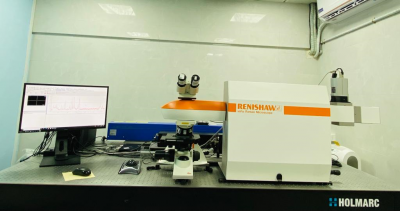
Renishaw. UK , Invia Reflex
Specifications/Features
- Spectrograph equipped with a research-grade microscope capable of producing Raman (wavenumber transfer 50 to 4000 cm-1) and PL (330 nm to 1.6 microns).
- Spectral Range of spectrometer: 200 nm – 1600 nm
- Excitation sources-
| Laser available | HeCd 325 nm | Diode 532 nm | HeNe 633 nm | Diode 830 nm |
| Power | > 25 mW | > 50 mW | > 17 mW | > 200 mW |
| Spectral resolution (FWHM) | 2 cm-1 with 2400 gr/mm | 0.5 cm-1 with 2400 gr/mm | 1 cm-1 with 1800 gr/mm | 0.75 cm-1 with 1200 gr/mm |
| PL | 330 nm to 1600 nm |
- Microscope Objective-1) Normal WD-5X,20X,100X ; 2) Long WD-50X ; 3) NUV-15X & 40X
- Imaging/Mapping –XYZ motorized and computer-controlled mapping stage with a minimum travel distance of 110x75x25 mm with a resolution of 50x50x10 nm. Scanning step size for 2D mapping to be better than 50 nm.
- Temperature- 10 to 300 K (CCR), Room temperature to 1500 K (Furnace)
- Libraries- Inorganic and minerals, polymeric materials, biochemical. Raman spectroscopy can provide both chemical and structural information, as well as the identification of substances through their characteristic Raman ‘fingerprint’. Raman spectroscopy extracts this information through the detection of Raman scattering from the sample.
- Other capabilities- Low wavenumber measurements (down to 15cm-1 with 532 nm laser), polarization study with 532 nm laser, remote probe fibre coupling with 532 nm laser.
Application
- Pharmaceuticals and Cosmetics
- Geology and Mineralogy
- Carbon Materials
- Semiconductors
- Life Sciences
- Polymer science
Faculty in-charge
Contact Email
id-lrs.crnts@iitb.ac.in
Location
Room No: LRS lab,208-A Floor No:1st Floor Dept. Name: SAIF/CRNTS
Website URL-https://www.crnts.iitb.ac.in/lris.html
Contact No: 022-2576 4573 022-2576 4675
Other Contact Person
- Pallavi Khapre
- Priyanka Jain
Facility Management Members